We are thrilled to introduce the new Planning For Profit™ software dashboard. Our intention was to provide you with a brief overview of your company’s status, performance, and perhaps some areas you might concentrate on as you start moving forward to make improvements. Let’s walk you through what each of the dials and tables on this dashboard display.
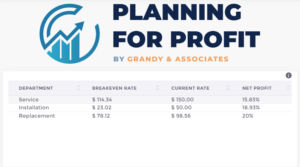
The first thing you’ll notice is that each department you’ve created will be listed in the upper left corner. Based on the data you’ve entered, you’ll get an at-a-glance view of your department’s breakeven rate, your current rate, and what net profit that current rate is generating for your company. You can select a particular department and the dials will begin to update and change for that specific department.
The Profitability Dials
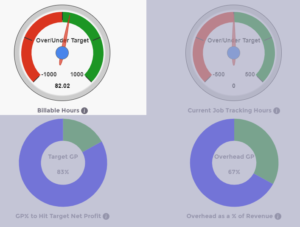
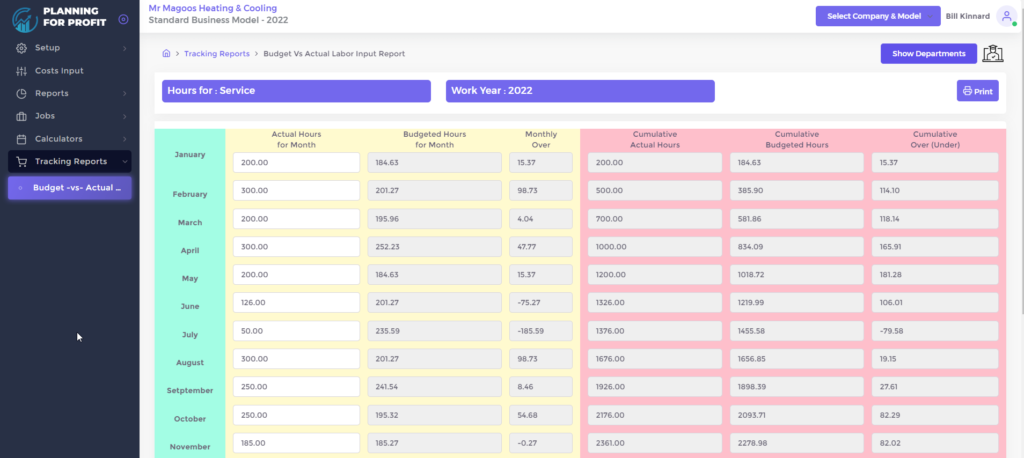
The first dial displays Billable Hours. Showing whether you are over or under your target by tracking the number of hours you billed out over the course of the year as opposed to what you had anticipated when you developed your model. As you utilize the software, a budget is created in the background for the number of hours you anticipate billing each year. In the Budget- vs- actual Labor Hours report, under the Tracking Reports tab on the left-hand side of your dashboard, you can enter your billed labor hours per department. Profit For Planning™ will then automatically generate the budget data. This budget is then shown in the dial for quick and easy reference. Zero or above should be your goal and if you meet it then you are invoicing out your projected number of hours. A green dial indicates that you’re doing great! If you are in the red, you may want to give extra attention to that department.
Current Job Tracking Hours
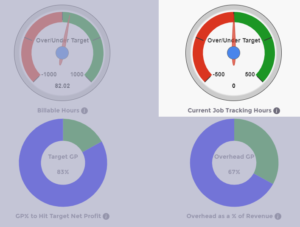
The second dial is the Current Job Tracking Hours, displays the total number of hours worked thus far this year. You can track where you are on each job by using the job tracking hours report. If you are working faster than anticipated and do projects in less time than you estimated, then the hourly difference between the anticipated time and the actual time is all profit. Or they can be used to offset any hours lost on other jobs that take longer than originally planned.
Gross Profit Net Percentage
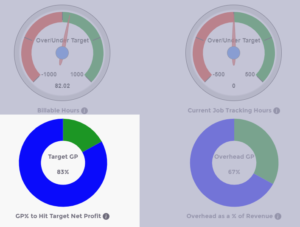
Gross Profit (GP) Net Percentage is your third dial. The target GP is the needed amount to cover all your fixed expenses, variable expenses, and desired net profits.
Overhead as a Percentage of Revenue
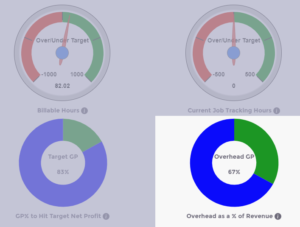
The fourth dial displays your Overhead as a Percentage of Revenue. It combines your fixed expenses and variable expenses and calculates the percentage of your net profits that are consumed by that total overhead. The difference between the value displayed in the third dial and the fourth dial is then displayed in your Net Profit column on the upper left corner of your screen.
Next, you’ll see Materials as a Percentage of Sales which tracks what percentage of your overall sale price goes to the cost of your materials for this department. As a rule, the cost of materials for many trades would be between 34% and 37%% of your gross sales. However, for many contractors, the cost of materials tends to be much more than that. If you are higher, then your gross profit and your pricing are too low and loss is happening somewhere- lost time, wasted materials, materials unaccounted for, etc.
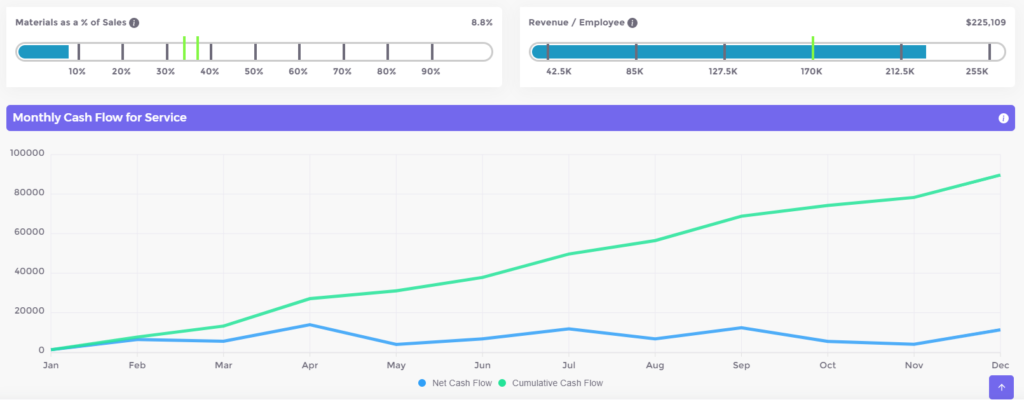
The Revenue Per Employee graph shows how much revenue each employee in the company contributes. 170,000 per full-time or full-time equivalent employee is the minimum target. If this number is too low, you’re not using your team effectively. If the number is too high, you’re starting to overextend the team. As a result, things may start to fall through the cracks, such as jobs where details are missed, and things will start to go wrong; it may be time to start looking to add new personnel.
Our final piece is the Monthly Cash Flow chart which tracks the cash flow for the department. The blue line tracks cash flow for the month and the green line cumulative for the year.
These dials will start to come to life as you enter data into your model and are a quick glance as to the health of your financial targets moving forward. If you have any questions on the new dashboard, feel free to contact us at Grandy & Associates.